In the last two years, we have used a solar cell system, a new water heater, an energy management system, and two new windows in our home in Bronbäklija in Hedalen. In addition, we replaced 23 outdated lighting sources with new LEDs.
The goal was to reduce electricity consumption, contribute to the green transition and save money on electricity and internet rent.
In this article, we share our experiences with readers.
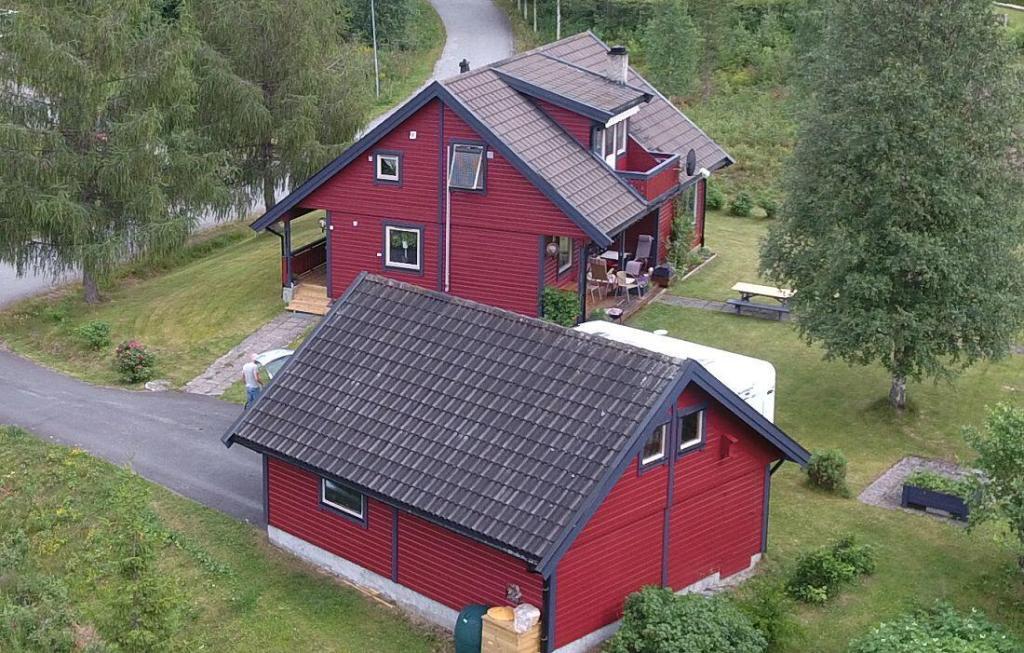
Solar System
We installed a solar system in November 2022. It snowed heavily while the work was in progress, and production at the end of this year was very small due to lack of sun, and the panels on the roof of the house and garage roof were damaged. Covered with snow sometimes.
However, snow falls easily from the panels. The angle of the garage roof and the roof of the house is 38 degrees.
We have a total of 24 boards. The supplier has prepared the following annual production forecasts:
| The current network rotates annually | 9,659 kWh |
| Private consumption | 4,173 kWh |
| Grid supply (sale of electricity) | 5,486 kWh |
| Share for private consumption | 43.1% |
This is how things went in 2023 compared to 2022
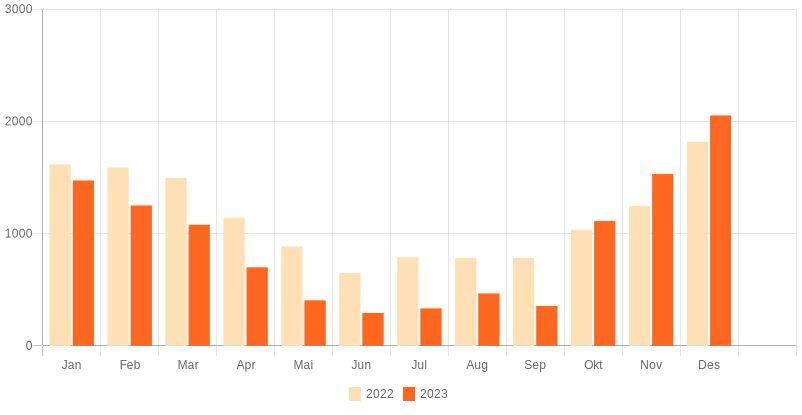
The graphic representation was copied from a recent email sent by our electricity company, Gudbrandsdal Energi.
In periods when consumption was less than what the solar plant produced, we sold the electricity to the electricity supplier.
Large parts of the country were warmer in 2022 than in 2023.
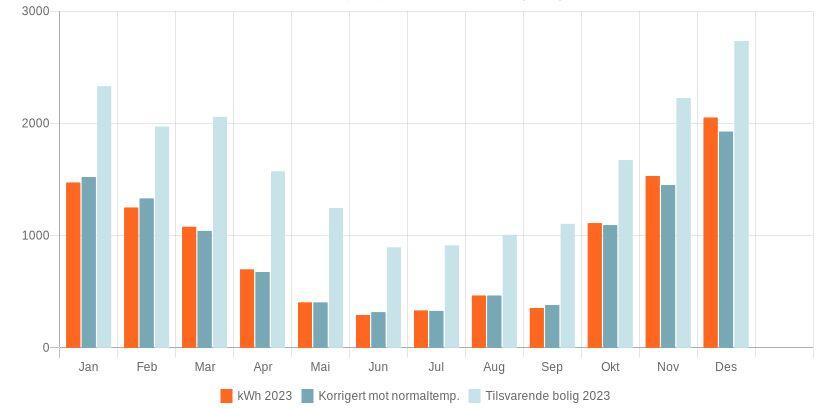
Production is carried out by Gudbransdal Energi.
Temperature-corrected consumption is calculated as energy consumption at normal temperatures. If it is colder than usual, the consumption is usually higher than the temperature correction, and vice versa if it is warmer than usual. The last three months of 2023 were cooler than usual.
Production (kWh) provided electronically, divided into months of the year:
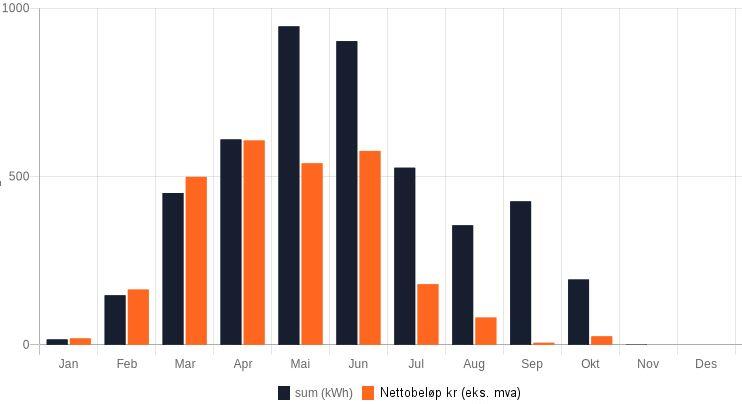
Production is carried out by Gudbrandsdal Energi.
Consumption and production in 2023
| Measured consumption | 11,037 kWh |
| Total production across solar cells measured in the app | 7,210 kWh |
| Sold to electricity provider | 4,578 kWh |
| Produced for private consumption | 2,632 kWh |
| Total electricity consumption | 13,669 kWh |
| Net consumption (gross consumption – self-production) | 6,459 kWh |
So we produced 7,210 kWh in 2023. Our plant is designed to produce up to 9,659 kWh per year. Production will vary from year to year.
Most of the electricity was produced in the months of March, April, May, June and July. These were sun-filled months.
In August, production was lower than in September, and snow settled on the solar cells in October and remained in November and December.
Economy
We do not know how electricity prices and network rents will develop in the coming years. We received support from Enova for our solar cell system, new water heater, and energy management system. There are several support systems that we recommend readers become familiar with.
| Total electricity cost including electricity subsidies in 2023 | 9,186 NOK |
| Total cost of electricity without electricity subsidies in 2023 | 13,301 NOK |
| Electricity sold to electricity supplier 4,578 kWh out. Value added tax. | 2,702 Norwegian krone |
| The value of electricity produced for private consumption, including value added tax. (At an average price per kWh of NOK 0.86 we had to buy it.) |
2,190 NOK |
| Electricity sold + electricity produced for direct personal consumption | 4,892 NOK |
Energy management
In November 2022, we put Futurehome's energy management system into use. It gave us the opportunity to program a nightly temperature reduction for two heating cables and two panel ovens. We control the heat pump manually.
We can also decide whether the electric vehicle should be charged when there is solar power and/or when the spot price is the lowest possible.
Water is heated in a Høiax boiler when the spot price is at its lowest possible price – usually at night.
The energy management system is programmed so that the maximum average hourly consumption does not exceed 8 kWh. The system can disconnect heating cables, furnaces and boilers during periods when our electricity consumption is high. It can also turn off the electric vehicle's charging power. With this system, we succeeded in reducing the maximum load on the network.
Online rental
The fixed rate, also called the capacity rate, is what you have to pay each month to have electricity connected. SAE calculates the amount based on the highest average hourly consumption you had last month.
Below you can see the capacity ladder in 2023 and 2024.
| capacity | Prices 2023 and 2024 include VAT. |
| 0-5 kWh | NOK 562.50/month. |
| 5-8 kWh | NOK 650.00/month. |
| 8-15 kWh | NOK 775.00/month. |
| 15-30 kWh | NOK 900.00/month. |
| 30-50 kWh | NOK 1,012.50/month. |
| 50 kWh | NOK 1,375.00/month. |
Maximum kWh
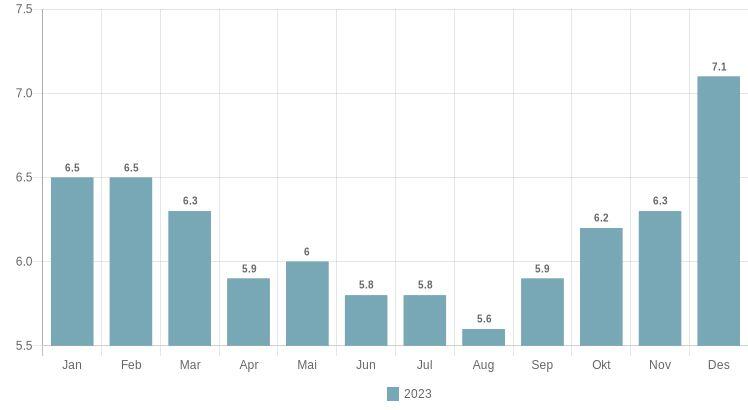
We believe that the energy management system resulted in a monthly saving of NOK 125 on the fixed link in online rental. In 2023, this saving amounts to NOK 1,500.
We pay grid rent for the electricity we buy, but we give up grid rent for the electricity we sell. We thus avoided paying energy costs and taxes for 2632 kWh (the self-produced electricity we used). This equals 0.542 NOK * 2,632 = 1,427 NOK. (Here we've used prices for April to September.)
summary
In the summary below, we have ignored the costs of the investments we have made.
| Lower electricity costs in 2023 | 4,892 NOK |
| Low flat rate online rental | 1500 Norwegian krone |
| Reduce energy costs and taxes | 1,427 Norwegian krone |
| Total savings: | 7,819 Norwegian krone |
We can add that we have an electric car. We mostly ship it at home. When there are good sunny conditions, you can save a lot by charging your car with self-produced electricity.
More measures
Our house was built in 1988. In January, we had the house thermally photographed. The summary explains that we can save electricity for heating by taking measures such as changing doors and windows. Our house is heated with electricity and wood.
Enova writes this in the article Ten simple tips to reduce electricity bills:
“The fact is that in an average house in Norway, up to 55 percent of the energy we use goes to heating rooms, and about 20 percent to hot tap water. Therefore the main opportunities to save electricity lie in heating rooms and using tap water for For most people, the last 25 percent of electricity use goes to lighting and the use of various electrical appliances and depth measuring devices.

“Web specialist. Lifelong zombie maven. Coffee ninja. Hipster-friendly analyst.”

